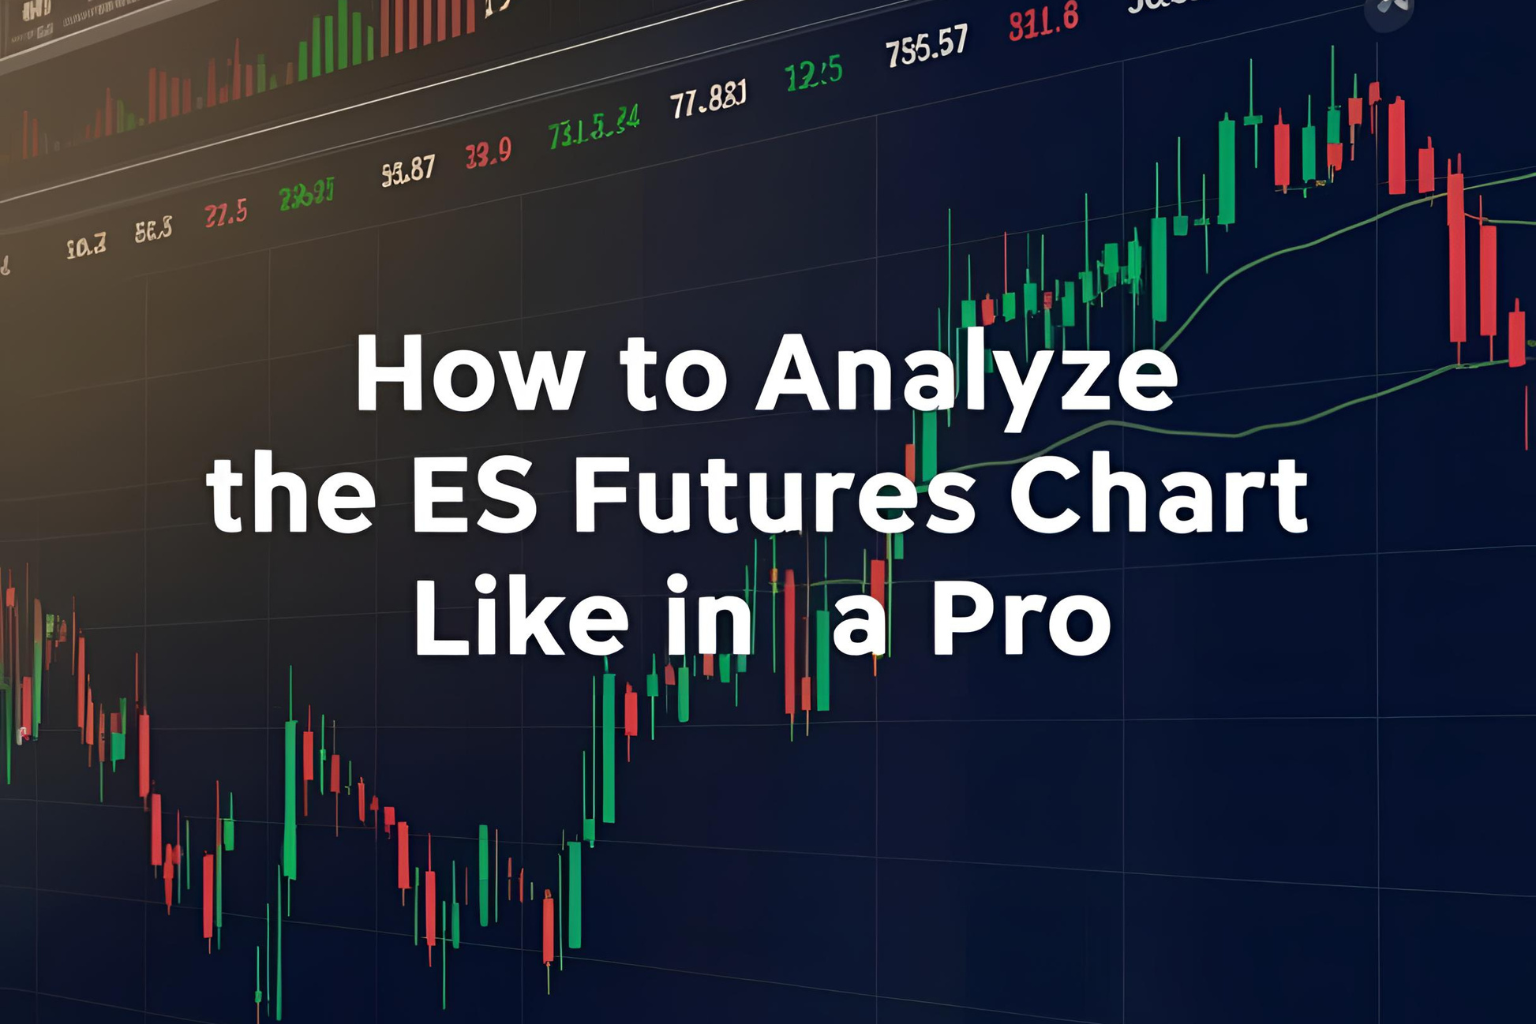
How to Analyze the ES Futures Chart Like a Pro
Mastering how to analyze the ES futures chart is a key skill for successful trading. Whether you’re day trading or swing trading, reading the chart helps you understand price behaviour, spot high-probability setups, and make confident trade decisions.
This guide covers the essential methods pros use to interpret ES charts with clarity and precision.
Step 1: Choose the Right Timeframe
Your analysis begins with selecting the proper chart timeframe based on your trading style.
- 1-min to 5-min charts – Best for scalping
- 15-min to 1-hour charts – Suitable for intraday strategies
- 4-hour and daily charts – Ideal for swing and trend analysis
- Weekly charts – For long-term context and macro view
Always start your analysis on a higher timeframe, then zoom in for entries.
Step 2: Identify the Trend
Determining market direction is your foundation:
- Higher highs and higher lows → Uptrend
- Lower highs and lower lows → Downtrend
- Sideways movement → Consolidation
Use tools like moving averages (e.g., 20 EMA, 50 SMA) to visually confirm the trend.
Step 3: Draw Key Support and Resistance Levels
Support and resistance levels are zones where price tends to reverse or pause.
How to find them:
- Look for previous highs and lows
- Use round number levels (e.g., 4200, 4300)
- Observe consolidation zones
- Apply Fibonacci retracement for swing moves
These levels serve as potential entry, exit, or stop-loss zones.
Step 4: Apply Technical Indicators (Sparingly)
Overloading your chart can lead to confusion. Use 1–2 indicators for confirmation:
- VWAP: Shows average price with volume context — excellent for intraday trades
- RSI (Relative Strength Index): Highlights overbought or oversold conditions
- MACD: Identifies trend direction and momentum
- ATR (Average True Range): Measures volatility and helps with stop placement
These indicators should support your price action, not replace it.
Step 5: Look for Chart Patterns
Professional traders often watch for well-known chart formations:
- Flags and Pennants: Continuation patterns after strong moves
- Double Tops/Bottoms: Reversal signs
- Head and Shoulders: Strong reversal pattern
- Trendline Breakouts: Signals shift in structure
These patterns can offer both entry and exit opportunities with good risk-to-reward ratios.
Step 6: Confirm with Volume and Price Action
Volume confirms strength behind moves. For example:
- High volume on a breakout = strength
- Low volume on a pullback = healthy retracement
- Sudden volume spikes at support/resistance = potential reversal
Also pay attention to candlestick formations like dojis, engulfing patterns, or hammers to refine your entries.
Step 7: Use Multiple Timeframe Analysis
Before entering a trade, check:
- Higher timeframe trend (e.g., 4H or daily)
- Lower timeframe entry setup (e.g., 5M or 15M)
This ensures you’re trading in the direction of the broader move while refining entries for precision.
Final Thoughts
To analyze the ES futures chart like a pro, focus on simplicity, structure, and consistency. Start with the trend, mark key levels, use supporting indicators, and align your strategy with the market environment. The more you practice structured analysis, the clearer your trade setups will become.
Always keep a journal of your chart analyses — it builds skill over time and helps refine your eye for market patterns.
FAQs
1. What’s the best timeframe for analyzing ES futures?
Use multiple timeframes — daily for trend, 15-min for entries is a popular combo.
2. Do I need indicators to analyze ES charts?
No, but tools like VWAP, RSI, or ATR can enhance price action analysis.
3. What chart type is best for ES futures?
Candlestick charts are most popular as they show open, high, low, and close visually.
4. Can I analyze ES futures on TradingView?
Yes, TradingView provides advanced charting tools and access to ES contract data.
5. What are common chart patterns to watch?
Look for flags, head and shoulders, double tops/bottoms, and trendline breaks.
